A data scientist reports that their large-scale training job on a shared GPU cluster is running extremely slowly, even though the scheduler has allocated them adequate GPU compute resources. Your monitoring tools show that GPU compute utilization is very low, but local storage I/O activity is consistently maxed out. What is the most likely cause of this performance problem?
Select an answer to reveal the explanation.
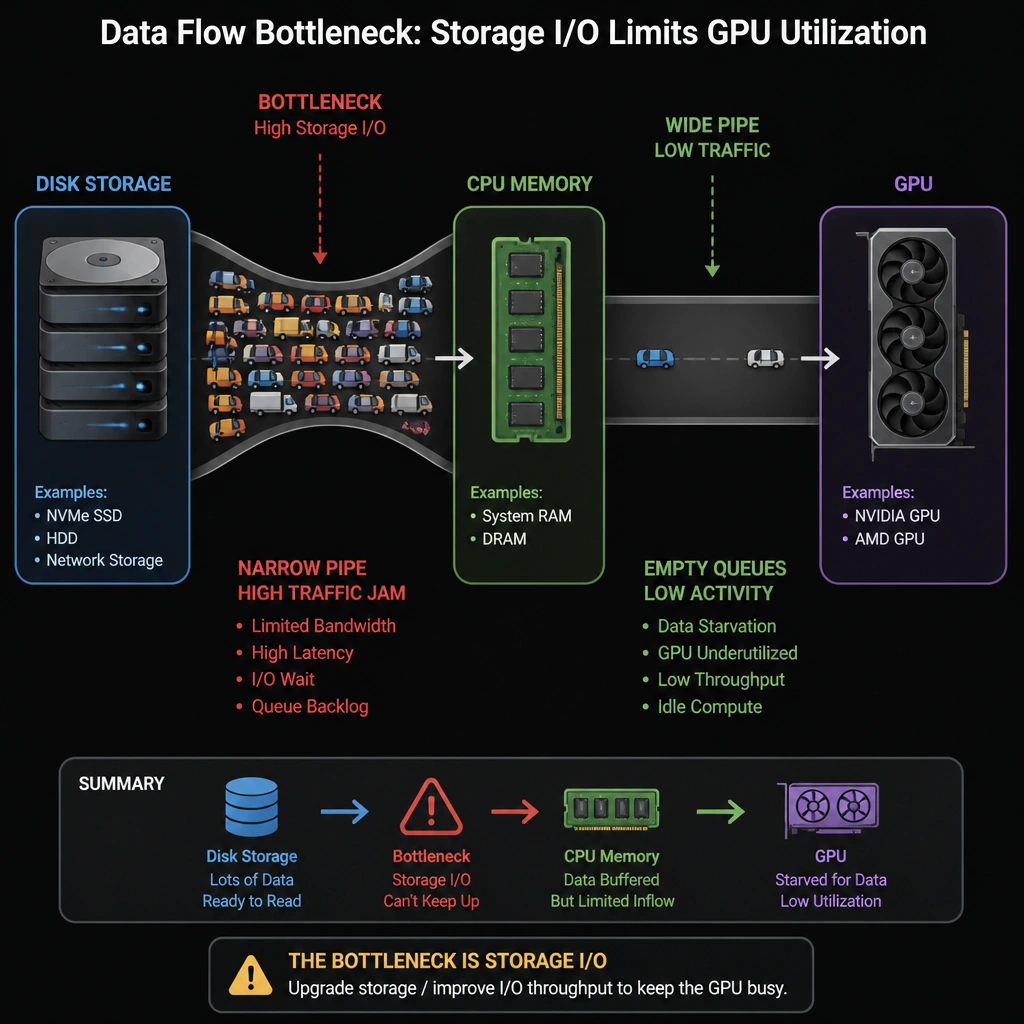
Short Explanation and Infographic
Here's the deal: GPUs are absolute speed demons, but they are also incredibly hungry. If you don't feed them data fast enough, they're just going to sit there twiddling their thumbs. That's what we call a data-starvation bottleneck. If you look at your performance monitor and see disk I/O pinned at 100% while your expensive GPUs are sitting at 5% utilization, your storage system is the bottleneck. The code is trying to read millions of tiny files off a slow disk one by one, and the GPU is starving. To fix this in the real world, you've got to optimize that data pipeline—use multi-threaded loading, prefetch data into RAM, or pack those images into binary formats. Trust me on this, a fast GPU with a slow storage pipeline is just a very expensive space heater.
Full explanation below image
Full Explanation
In deep learning pipelines, performance is determined by the slowest component in the system. While GPUs are optimized for rapid parallel computation, they rely on the host CPU and storage subsystem to supply them with training data. If a training job involves millions of individual files (such as high-resolution images or audio clips) and reads them directly from disk sequentially, the storage read bandwidth or disk seek times will bottleneck the system. This manifests as high storage I/O and low GPU compute utilization: the disk is working at its limit, while the GPUs spend most of their time idle, waiting for data batches to be loaded into memory. To resolve this, administrators and developers can implement several data loading optimizations: 1. Prefetching: Loading the next batch of data into host RAM while the GPU is processing the current batch. 2. Parallel Data Loading: Utilizing multi-threaded data loaders (such as setting num_workers > 0 in PyTorch) to read and preprocess data in parallel. 3. Optimized Storage Formats: Packing thousands of small files into large, contiguous binary container formats (like TFRecord, WebDataset, or HDF5) to enable sequential read operations instead of random seeks. 4. Fast Storage Media: Storing training datasets on high-performance local NVMe SSDs or high-throughput distributed parallel file systems. Let's analyze the incorrect options: - CUDA driver mismatches (Option A) typically prevent the training job from starting at all or cause execution crashes, not a slow run with high disk I/O. - Overcommitted CPU cores (Option B) would show up as high CPU scheduler latency and high CPU utilization, but would not naturally peg storage read activity at 100% capacity. - VRAM oversubscription (Option C) would lead to out-of-memory (OOM) errors or heavy PCIe transfer overhead, but wouldn't display as persistent local disk storage read activity. In real-world enterprise architectures, this problem highlights the need for a balanced system design. You cannot simply install high-end GPUs into a legacy server chassis with mechanical hard drives and expect peak performance. The storage infrastructure must scale alongside the compute capabilities to prevent data starvation and maximize the return on GPU investment. Thus, inefficient data loading is the bottleneck.