A data science team has conducted a series of empirical experiments, training a classifier on fifty different datasets using various combinations of learning rate, regularization strength, and network depth. To mathematically determine the strength and direction of the linear relationships between these design inputs (hyperparameters and dataset features) and the resulting model metrics (generalization error and training accuracy), which statistical approach should they employ?
Select an answer to reveal the explanation.
Short Explanation and Infographic
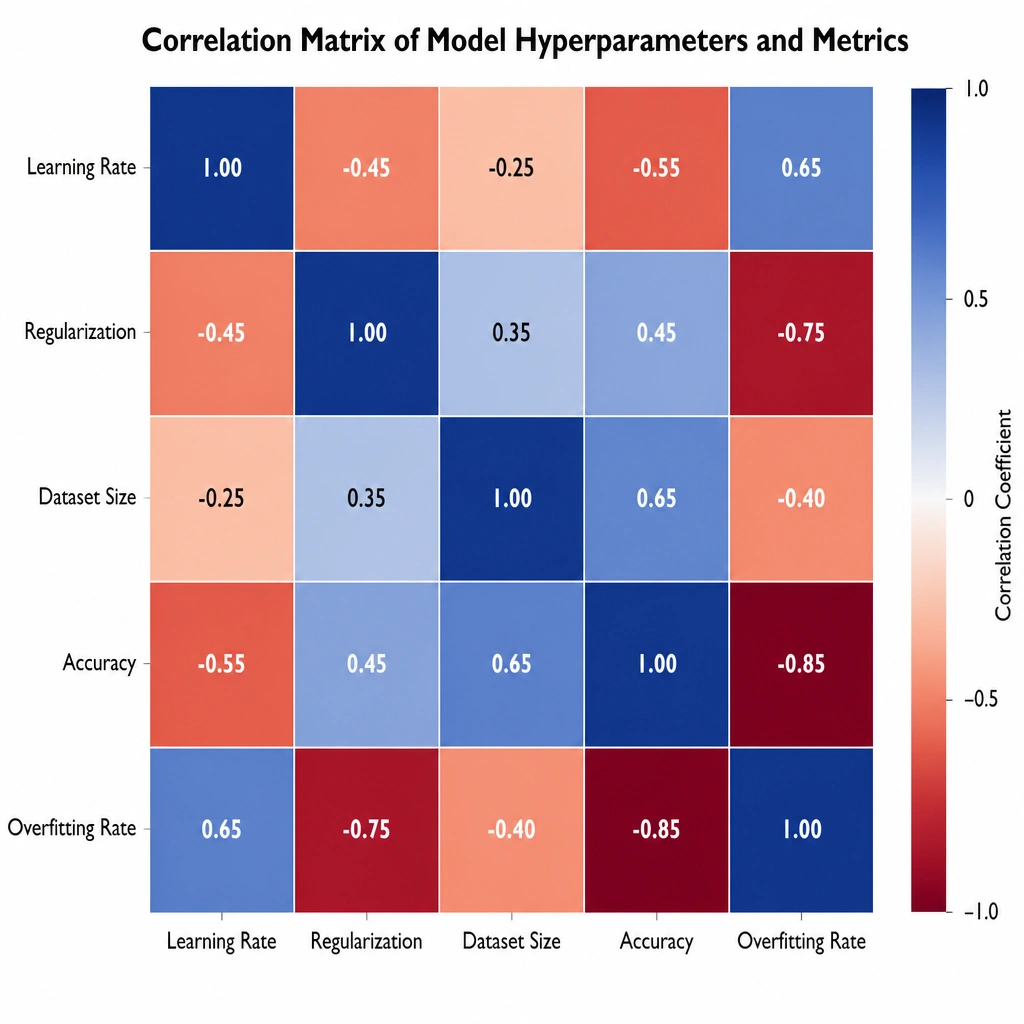
Think of it like this: you have a massive spreadsheet of results. You've got columns for learning rate, regularization, dataset size, validation accuracy, and overfitting scores. You want to know: "If I increase regularization, does accuracy go up or down? And how does dataset size affect that?" To find out, you calculate a correlation matrix. It gives you a clean grid of numbers between -1 and +1 showing exactly how every single variable relates to the others. A value close to +1 means they move up together, while -1 means they move in opposite directions. It's like a cheat sheet showing you exactly which levers to pull to optimize your model. PCA will just compress your data and hide these relationships, and pie charts won't show you the connections between variables. Use a correlation matrix and you'll see the big picture!
Full explanation below image
Full Explanation
Analyzing machine learning experiments requires understanding how multiple inputs (independent variables like hyperparameters and dataset characteristics) correlate with multiple outputs (dependent variables like accuracy, loss, and overfitting metrics). - A correlation matrix computes the correlation coefficients (typically Pearson or Spearman) between all pairs of variables in a dataset. This matrix allows researchers to quantify the linear relationship (strength and direction) between specific hyperparameters (e.g., regularization coefficient), dataset characteristics (e.g., feature count), and performance outcomes (e.g., generalization gap). It helps identify which hyperparameters are most influential under specific dataset conditions. - PCA is a dimensionality reduction technique. While it helps in compressing features, it projects variables into a new coordinate system (principal components), which obscures the direct interpretability of individual hyperparameters and their relationships with performance. - Pie charts cannot represent relationships between continuous variables and only displays single-variable distributions. - A line plot of validation loss history details a single training run's progress over time, failing to capture cross-trial hyperparameter relationships.