A data science team is testing various combinations of preprocessing steps (e.g., image resizing, pixel normalization, and data augmentation) to see how they impact both training duration and validation accuracy. Which analytical approach is most appropriate to evaluate how these preprocessing methods simultaneously influence these performance metrics?
Select an answer to reveal the explanation.
Short Explanation and Infographic
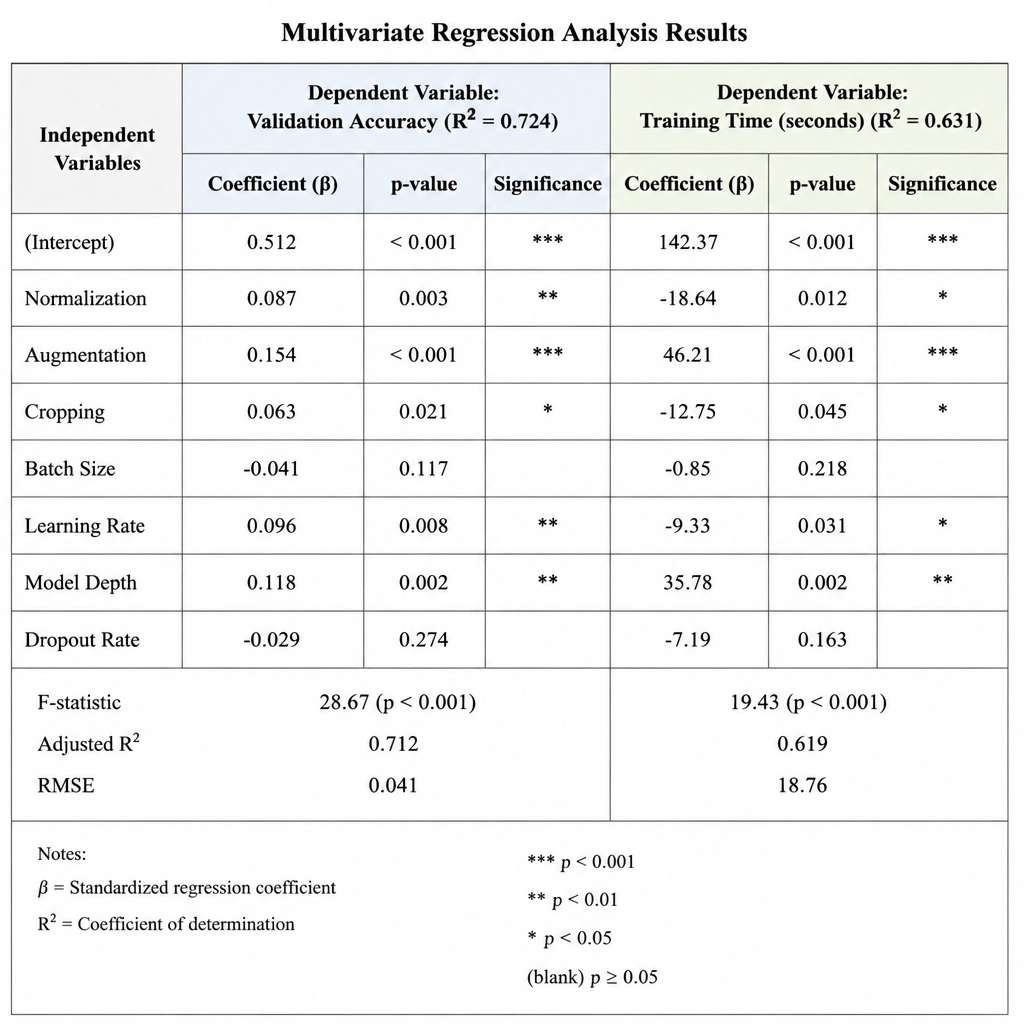
Let me show you how this works in the real world. Imagine you're trying to figure out if normalizing your inputs, resizing images, or adding random crops makes your training faster and your model smarter. If you try to analyze these one-by-one using basic t-tests or look at simple line charts, you're missing the big picture because these features interact with each other. By running a multivariate regression, you can throw all these preprocessing variables in as inputs (independent variables) and see exactly how they affect your outputs (dependent variables like speed and accuracy) at the exact same time. It's the most robust way to find out what's actually driving performance. Got it? Sweet. Let's keep rolling.
Full explanation below image
Full Explanation
When analyzing the impact of multiple experimental conditions (preprocessing techniques) on multiple outcomes (accuracy and training time), data scientists need a method that can handle multiple variables simultaneously. Multivariate regression analysis (Option C) is the most effective statistical method for this task. It models the relationship between multiple independent variables (the various preprocessing techniques) and multiple dependent variables (accuracy and training time). This allows the team to control for confounding variables, measure the relative impact of each preprocessing step, and identify interaction effects between different techniques. Independent t-tests (Option A) only compare the means of two groups for a single variable at a time, failing to capture complex interactions and increasing the risk of Type I errors (false positives) when run repeatedly. Line charts (Option B) are visualization tools that show trends but do not provide statistical significance or quantify multi-variable relationships. Pie charts (Option D) represent parts of a whole and are completely unsuitable for analyzing relationships between variables. Thus, multivariate regression is the correct choice.