You are running a deep learning training job across a multi-GPU server. While monitoring the system, you observe that GPU 0 is pinned at 100% core utilization, whereas GPUs 1, 2, and 3 are sitting mostly idle, showing utilization values below 10%. What is the most likely cause of this imbalance?
Select an answer to reveal the explanation.
Short Explanation and Infographic
Check this out: you've spent big bucks on a multi-GPU server, and you expect all those processors to scream along together. But instead, you've got one GPU doing all the heavy lifting while the other three are basically taking a nap. What's the deal? Nine times out of ten, this is a data pipeline problem. If your code is loading data on a single CPU thread and dumping it onto the first GPU, or if your data loader isn't configured to shard and distribute the dataset across all the workers, you get a massive bottleneck. The busy GPU has to wait for data, or the other GPUs are starving because they aren't getting their fair share of the training batch. You need to use tools like PyTorch's DistributedDataParallel and set up your DataLoader with a DistributedSampler to make sure every GPU gets fed at the exact same time. Got it? Sweet.
Full explanation below image
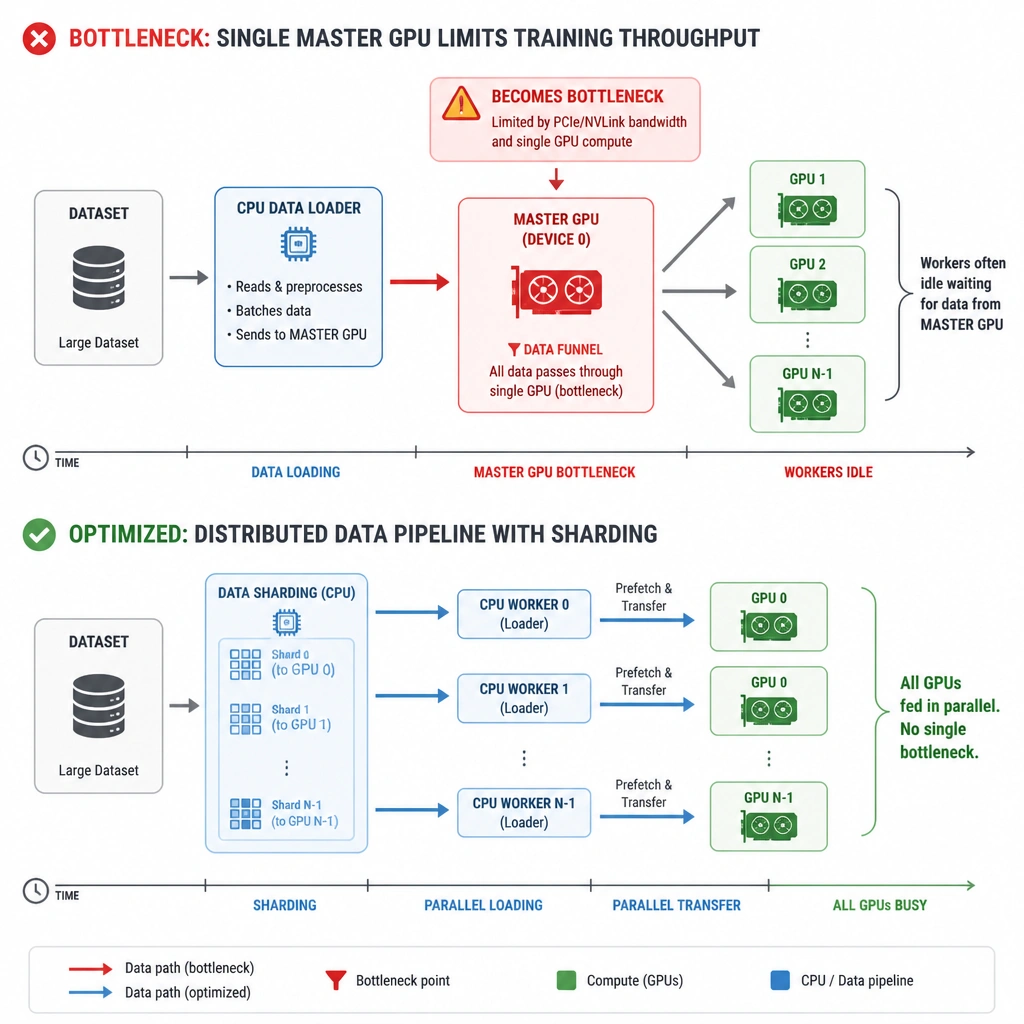
Full Explanation
In multi-GPU training setups (using paradigms like Data Parallelism or Distributed Data Parallelism), achieving high scaling efficiency requires that all GPUs participate equally in the computation. If resource monitoring reveals that one or a subset of GPUs is running at 100% utilization while others are idle, the root cause is typically a bottleneck in the data ingestion pipeline.
When utilizing Data Parallelism (DP), a common issue is that a single primary GPU (often GPU 0) is responsible for gathering the gradients, calculating loss, updating the model weights, and distributing the updated model and new data batches to the other GPUs. If the input pipeline (implemented via CPU-based data loaders) cannot read, preprocess, and transfer batches to the secondary GPUs fast enough, or if the data partitioning is uneven, the secondary GPUs will starve for data. They will sit idle while the primary GPU is pinned at maximum load. To solve this, developers use Distributed Data Parallelism (DDP), where each GPU runs its own dedicated process, and a DistributedSampler divides the dataset beforehand, preventing the master-GPU bottleneck.
Let's analyze the incorrect options: Driver display output throttling: Enterprise-class GPUs (like NVIDIA A100 or H100) are headless and do not require display connections; their driver does not throttle performance based on active displays. NVLink communication failure: While disabling NVLink would slow down communication, it would typically result in all GPUs having similar (though lower) utilization as they wait for inter-GPU syncs, rather than causing a massive imbalance where some GPUs are at 100% and others are completely idle. * Model too small to partition: If the model is small, it would run very quickly on a single GPU, but it would not cause other GPUs in a multi-GPU job to report idle state while one is pinned, unless the user incorrectly configured the distributed training script to only target one GPU, which is a setup issue rather than a dynamic slowing down during execution.