An infrastructure team wants to analyze how hardware parameters like GPU memory capacity, NVLink bandwidth, and tensor core count collectively impact AI model training throughput and final loss. Which analytical approach will allow them to quantify the individual and combined influence of these hardware variables on model performance?
Select an answer to reveal the explanation.
Short Explanation and Infographic
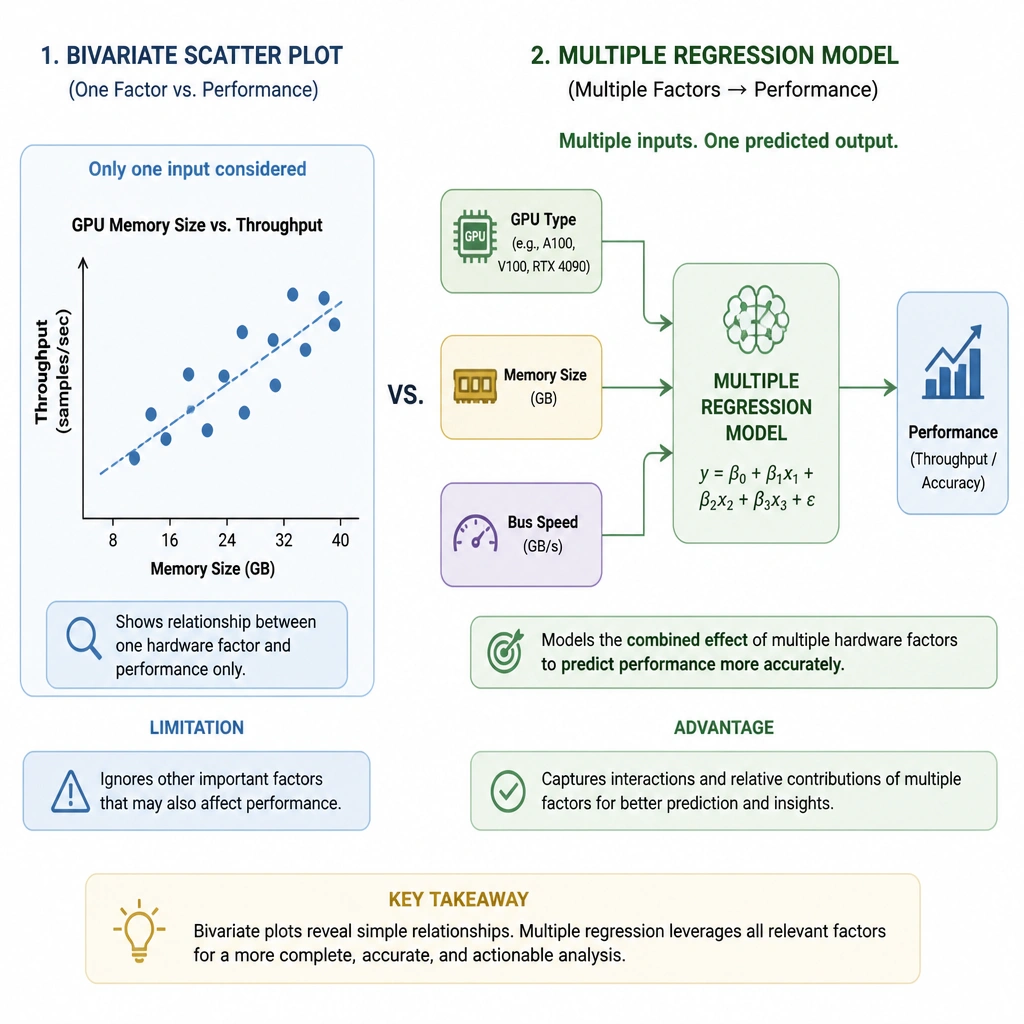
Check this out: if you're trying to figure out how a bunch of different things like NVLink speed, memory size, and GPU type all work together to affect your training speed and accuracy, you can't just look at one chart and call it a day. A scatter plot or bar chart only shows you two things at once—like trying to drive by only looking out the side window. If you want to know how all these variables interact and what actually moves the needle, you need multiple regression analysis. It takes all your hardware specs as independent variables and lets you see exactly how they impact your dependent variables, like training throughput or loss. Trust me, in a real production environment, this is how you justify spending the big bucks on faster interconnects or more memory to your boss. Got it? Sweet.
Full explanation below image
Full Explanation
To analyze the impact of multiple independent variables (such as GPU memory capacity, interconnect bandwidth, and processor type) on a dependent variable (such as training throughput or model accuracy) simultaneously, multiple regression analysis is the most appropriate statistical method. Unlike simple bivariate visualizations or pairwise correlation tools, regression analysis constructs a mathematical model that quantifies the relationship between all inputs and the output. This allows engineers to determine not only whether a relationship exists but also the magnitude and statistical significance of each hardware factor's contribution while controlling for other variables.
Let's examine why the distractors are less effective: - Bivariate scatter plots (Option A) are useful for viewing the relationship between exactly two continuous variables (e.g., memory size vs. throughput). They fail to show how other variables, like interconnect speed, might be confounding the results or working in tandem with the primary variable. - Clustered bar charts (Option C) display aggregate performance across discrete hardware groups. While helpful for basic comparisons of fixed node configurations, they do not provide a predictive mathematical relationship or quantify the individual sensitivity of continuous variables like bandwidth or memory. - Correlation matrix heatmaps (Option D) only illustrate pairwise, linear relationships. They cannot isolate the collective or combined influence of multiple variables on a target metric, nor do they establish a predictive model.
In AI infrastructure design, utilizing regression models helps optimize hardware spend by revealing bottlenecks. For example, it can help determine if increasing GPU memory is more cost-effective for a specific workload than upgrading from PCIe Gen4 to Gen5. Thus, regression analysis provides a comprehensive, multidimensional view necessary for complex systems.