While monitoring a GPU cluster in an AI data center, you notice that several nodes are consistently reporting high GPU memory (VRAM) usage but extremely low compute utilization (SM occupancy). What is the most likely cause of this situation?
Select an answer to reveal the explanation.
Short Explanation and Infographic
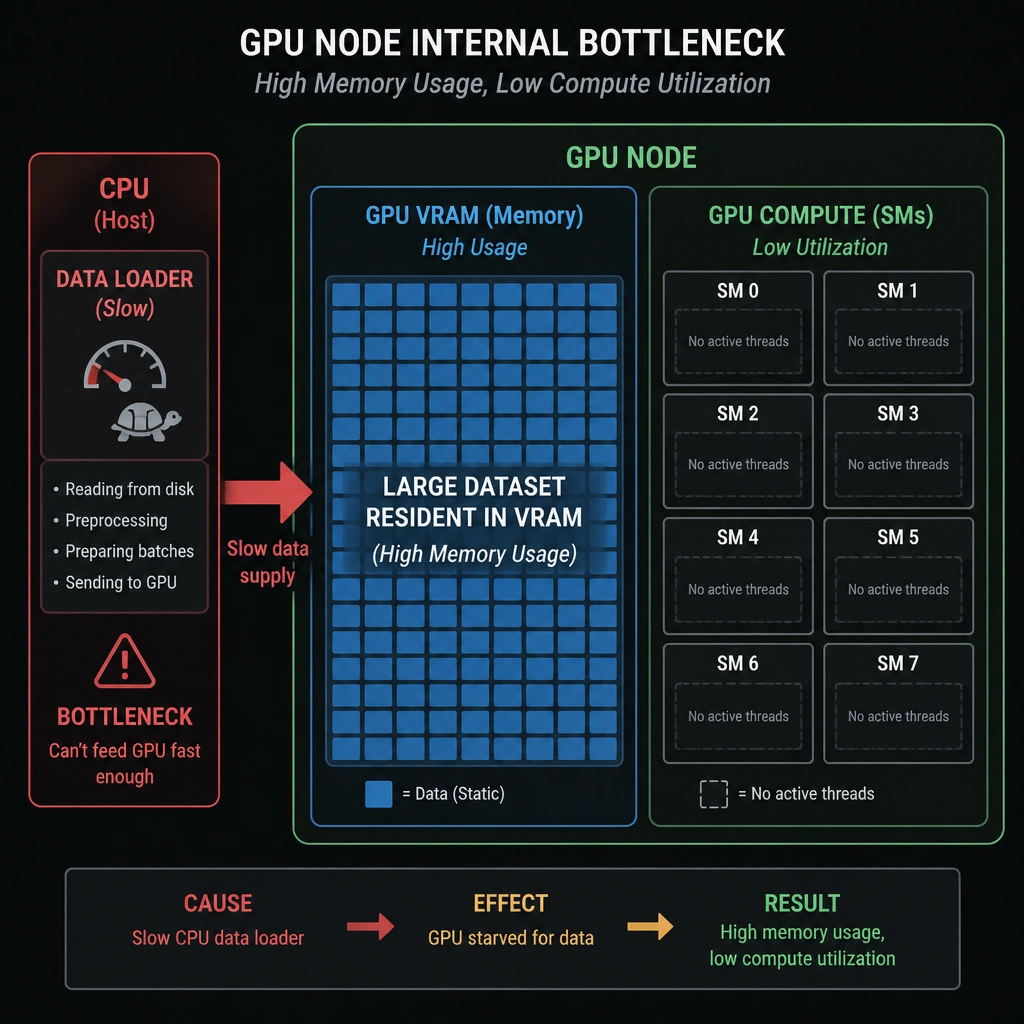
Okay, let's dive in. Imagine you rent a massive warehouse, fill it to the ceiling with boxes, but only hire one guy to move one box an hour. The warehouse is full (high memory usage), but nothing is actually happening (low compute). That's exactly what's happening when your GPU memory is maxed out but your compute utilization is sitting at 2%. Here's the deal: some application loaded a massive dataset or a huge model into the GPU's memory (VRAM), but the data pipeline is stuck. Maybe the CPU is dragging its feet preparing the next batch of data, or maybe the code is just waiting for user input. Either way, the GPU is holding the data but has nothing to compute. Outdated drivers or power limits won't cause this specific memory-heavy, compute-idle profile. You need to look at your code's data-loader pipeline!
Full explanation below image
Full Explanation
In GPU monitoring, a pattern of high Video RAM (VRAM) utilization paired with low streaming multiprocessor (SM) compute utilization indicates a data pipeline or execution bottleneck. When a deep learning framework initializes a training or inference task, it often pre-allocates a large chunk of GPU memory to store model parameters, activations, and input batches. However, if the GPU is not actively executing kernels, its compute utilization will remain low. This discrepancy commonly stems from host-to-device data transfer bottlenecks. For instance, if CPU-bound data preprocessing, augmentation, or disk I/O cannot keep up with the GPU's speed, the GPU will spend most of its time idle, waiting for the next batch of data to arrive, even though the model and current buffer are residing in VRAM. It can also occur in interactive environments (like Jupyter notebooks) where a model remains loaded in memory but is not actively running inference. Let's analyze the incorrect options: - Insufficient power supply or CPU thermal throttling (Option A) limits clock speeds and performance under heavy load, which would happen during high compute utilization, not when the compute engines are idle. - If the AI models were too small (Option B), both GPU memory usage and compute usage would be low, as small models do not require large memory allocations. - Outdated GPU drivers (Option C) or crashed telemetry would typically cause complete reporting failures or default fallback errors rather than a stable telemetry state of high memory and low compute. To debug this issue, engineers typically monitor the data loading pipeline using profiling tools like NVIDIA Nsight Systems. If the profiler shows that the GPU is frequently waiting for CPU threads to complete data fetching (manifested as 'cudaStreamSynchronize' or host-to-device memory copy bottlenecks), it confirms that the storage I/O or host-side preprocessing is the root cause. Solving it involves optimizing the CPU data-loading workers or utilizing GPUDirect Storage (GDS) to bypass the CPU entirely. Therefore, the most likely cause is that data or models are staged in memory, but a bottleneck elsewhere in the system is preventing execution.