You are comparing two machine learning models built to predict continuous values—specifically, estimating commercial property values based on features like square footage, location, and age. Model 1 is a linear regression model, and Model 2 is a random forest regressor. Which two statistical metrics are most appropriate for evaluating the prediction accuracy and explanatory power of these regression models? (Select two)
Select all correct answers, then click Submit.
Short Explanation and Infographic
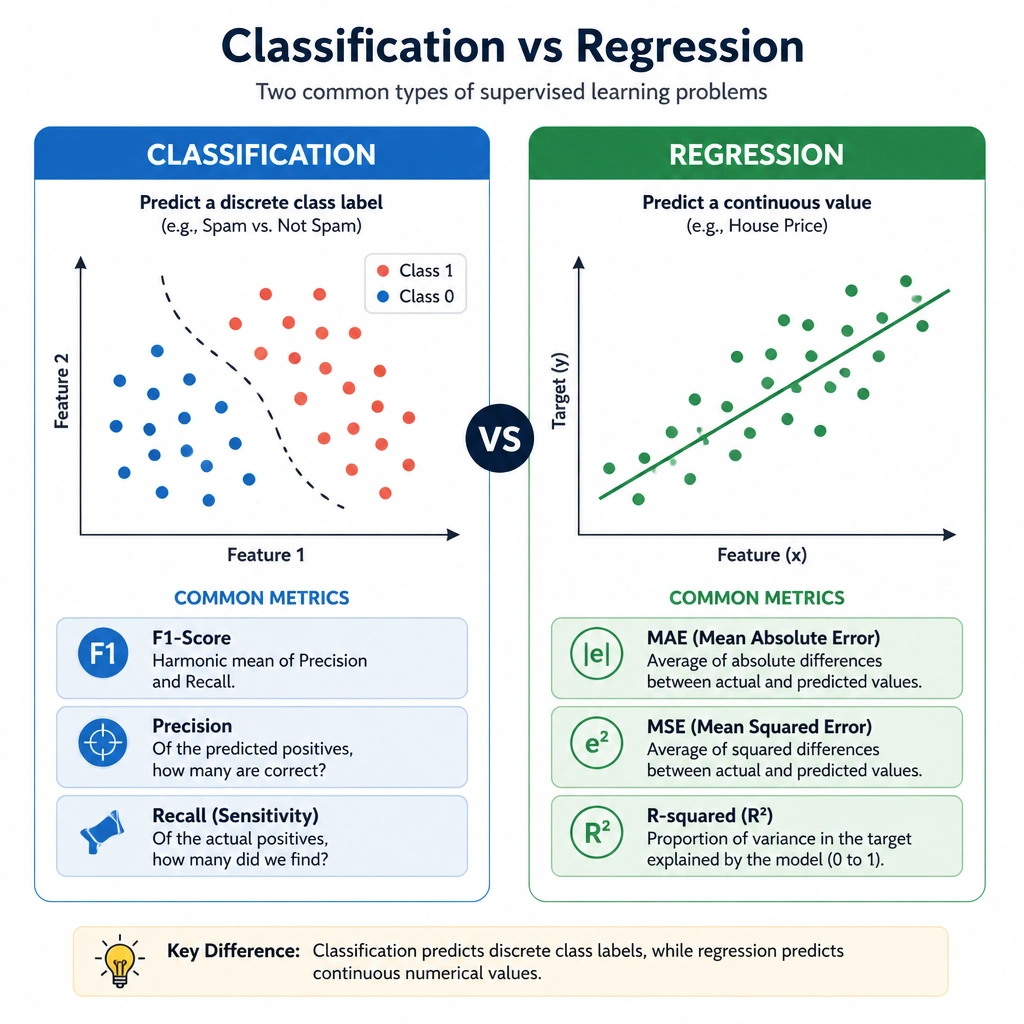
Here's the deal: before you evaluate a model, you have to look at the kind of problem you're trying to solve. In this scenario, we're predicting property values—continuous numbers like $500,000 or $1.2 million. This is a regression problem, not a classification problem. If you look at metrics like F1 Score (Option A) or Cross-Entropy Loss (Option C), those are designed for classification tasks, like telling if an image is a cat or a dog. Learning rate (Option E) isn't even a performance metric—it's a hyperparameter you tune during training. To measure how close your regression predictions are to the actual values, you use Mean Absolute Error (Option D), which gives you the average error in actual dollar amounts. To see how well your model explains the variance in the data, you look at R-squared (Option B). Trust me, getting these confused on the exam is a classic trap!
Full explanation below image
Full Explanation
Evaluating machine learning models requires selecting metrics that match the task's mathematical nature. Predicting commercial property values is a regression task because the target variable is continuous (numeric), rather than categorical (discrete).
1. Mean Absolute Error (MAE) (Option D): MAE measures the average magnitude of the absolute errors between the model's predictions and the actual values. It is calculated as the average of the absolute differences across all test samples. Because it is expressed in the same units as the target variable (e.g., dollars), it provides an intuitive measure of prediction accuracy. 2. R-squared (Coefficient of Determination) (Option B): R-squared measures the proportion of variance in the dependent variable that is predictable from the independent variables. Ranging from 0 to 1 (or negative in poor models), it indicates the goodness-of-fit and reliability of the model's explanatory power.
Analyzing the incorrect options: - Option A (F1 Score) is the harmonic mean of precision and recall. It is used exclusively in binary or multi-class classification tasks to evaluate the balance between false positives and false negatives. - Option C (Cross-Entropy Loss) measures the performance of a classification model whose output is a probability value between 0 and 1, quantifying the difference between two probability distributions. - Option E (Learning Rate) is a training hyperparameter that controls the step size at each iteration while moving toward a minimum of a loss function, not a performance metric for evaluating a trained model.
Therefore, MAE and R-squared are the correct metrics for assessing regression performance.