An operations team notices that several nodes in a GPU-accelerated Kubernetes cluster are experiencing performance bottlenecks, while other nodes sit completely idle. To properly diagnose the load imbalance and gather granular GPU metrics like Tensor Core activity, memory usage, and SM utilization, which tool should they implement?
Select an answer to reveal the explanation.
Short Explanation and Infographic
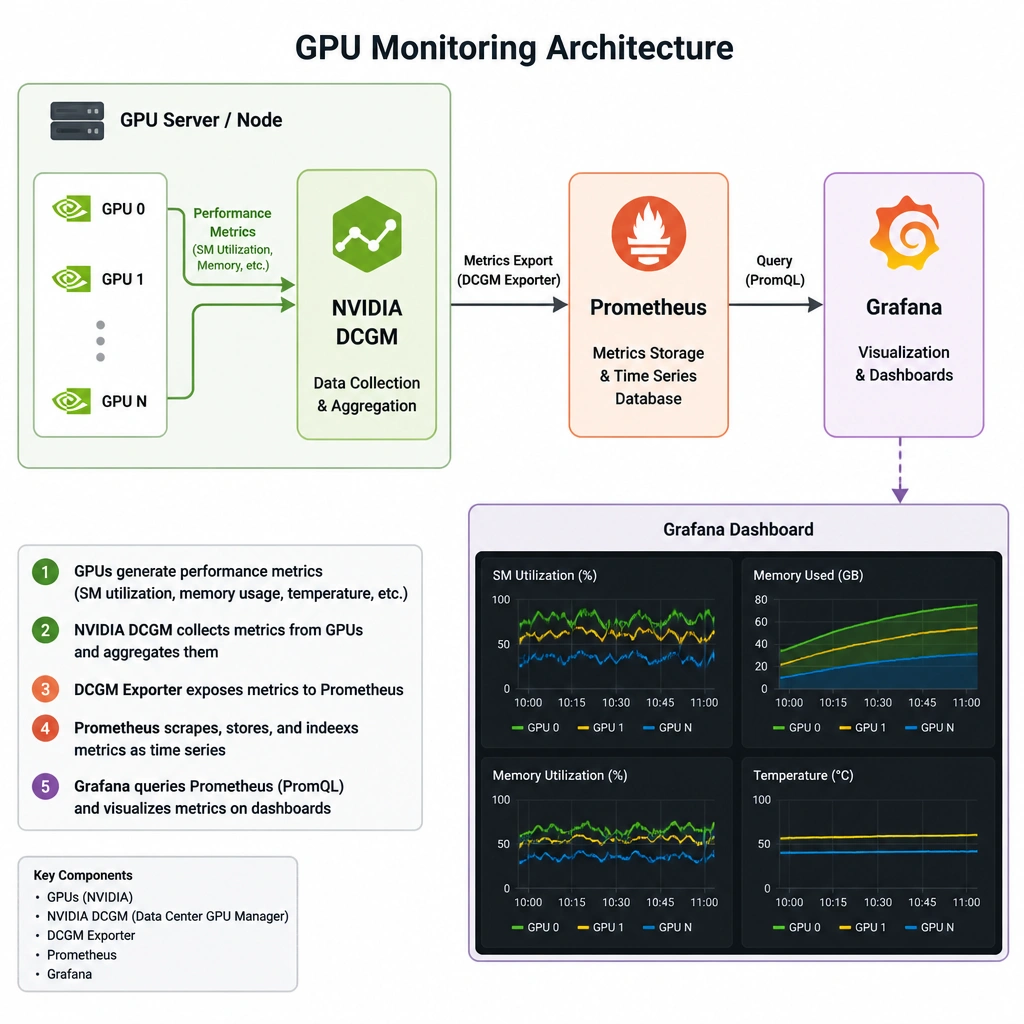
Imagine your boss walks in and says, "Our AI training cluster is dragging, but we're paying for eighty GPUs! What's going on?" If you just run standard Linux commands like top or check disk logs, you're only looking at CPU and disk metrics. Those tools are completely blind to what's happening inside the GPU itself. To see under the hood of an accelerator, you need NVIDIA DCGM — Data Center GPU Manager. This tool gives you the real-world ground truth: streaming multiprocessor (SM) utilization, VRAM usage, and health checks across your whole fleet. Hook it up to Prometheus and Grafana, and you've got real-time dashboards showing exactly where the traffic jams are. Got it? Sweet. Let's keep rolling.
Full explanation below image
Full Explanation
Standard system monitoring tools (such as top, htop, or basic OS-level agents) are designed to monitor host CPU, memory, and disk utilization. They cannot query the internal state of hardware accelerators like NVIDIA GPUs. - NVIDIA Data Center GPU Manager (DCGM) is a suite of tools designed specifically for managing and monitoring NVIDIA GPUs in clustered environments. It queries low-level GPU parameters (including SM utilization, memory bandwidth, temperature, power draw, and PCIe throughput) and can export these metrics to time-series databases like Prometheus for visualization in Grafana. This allows administrators to detect load imbalances, throttled cards, or underutilized resources across the cluster. - Standard Linux performance utilities (top and sar) only report CPU and system memory usage, leaving administrators blind to GPU compute bottlenecks or underutilization. - Syslog analyzers are used for system-level errors and log analysis but do not capture real-time performance or utilization metrics of GPUs. - SMART disk monitoring only tracks storage device health and performance, which is unrelated to GPU execution imbalances.