Imagine your team has just deployed a massive transformer model across a multi-GPU node for production inference, but the system's latency is spiking way past acceptable limits. A senior engineer asks you to investigate if the GPUs are hitting a memory bottleneck, leaking memory, or throttling. What command-line utility should you use to check real-time GPU memory consumption, temperature, and utilization?
Select an answer to reveal the explanation.
Short Explanation and Infographic
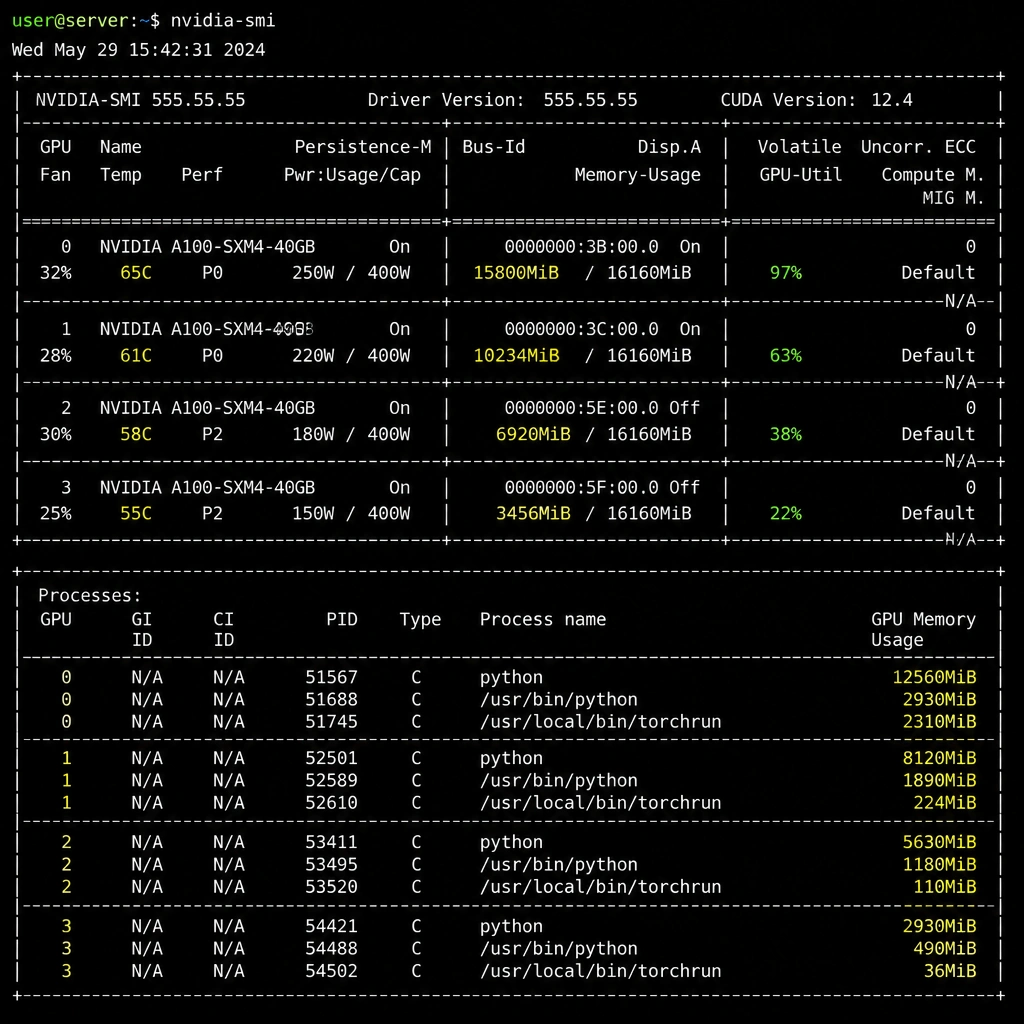
Check this out: when things go slow on a GPU server, the very first tool you grab is nvidia-smi. It's the Swiss Army knife for NVIDIA hardware. I can't tell you how many times I've walked into a server room — or logged into a cloud instance — and found a model sucking up every last byte of VRAM because someone forgot to clear the cache during inference. Using nvidia-smi lets you see exactly how much frame buffer memory is being consumed, which processes are running on which GPU, and even if the card is overheating and throttling. Host utilities like top or htop only show what the CPU is doing, which won't help you when the bottleneck is sitting on the PCIe bus. Got it? Sweet. Let's keep rolling.
Full explanation below image
Full Explanation
Troubleshooting performance degradation on GPU-accelerated workloads requires specialized tools because standard operating system monitoring tools (like top, htop, or vmstat) only capture CPU and system RAM metrics, completely overlooking the GPU's state. The System Management Interface (nvidia-smi) is a command-line utility based on the NVIDIA Management Library (NVML). It provides detailed, real-time monitoring of NVIDIA GPU devices, including GPU utilization, temperature, power draw, fan speed, and critically, GPU memory (VRAM) usage. During inference, performance degradation is frequently caused by out-of-memory (OOM) issues, memory leaks, or improper batch sizing that exceeds the available VRAM, causing slow page migrations or execution failures. Checking host CPU context switches via logs (Option A) or virtual machine RAM and swap utilization (Option C) only shows host-side CPU and memory metrics, which does not pinpoint GPU-specific resource constraints. Verifying dataset configurations (Option D) is unrelated to dynamic runtime execution bottlenecks during deployment. Therefore, inspecting live GPU memory allocation and running processes using nvidia-smi (Option B) is the most direct and effective troubleshooting step.