You are troubleshooting a performance issue in a deep learning cluster where training jobs are taking significantly longer than expected. You need to identify whether the bottleneck is computational (the GPUs themselves are fully utilized) or external (e.g., data pipeline or network storage latency). Which specific telemetry metric is the most direct indicator of active GPU processor utilization?
Select an answer to reveal the explanation.
Short Explanation and Infographic
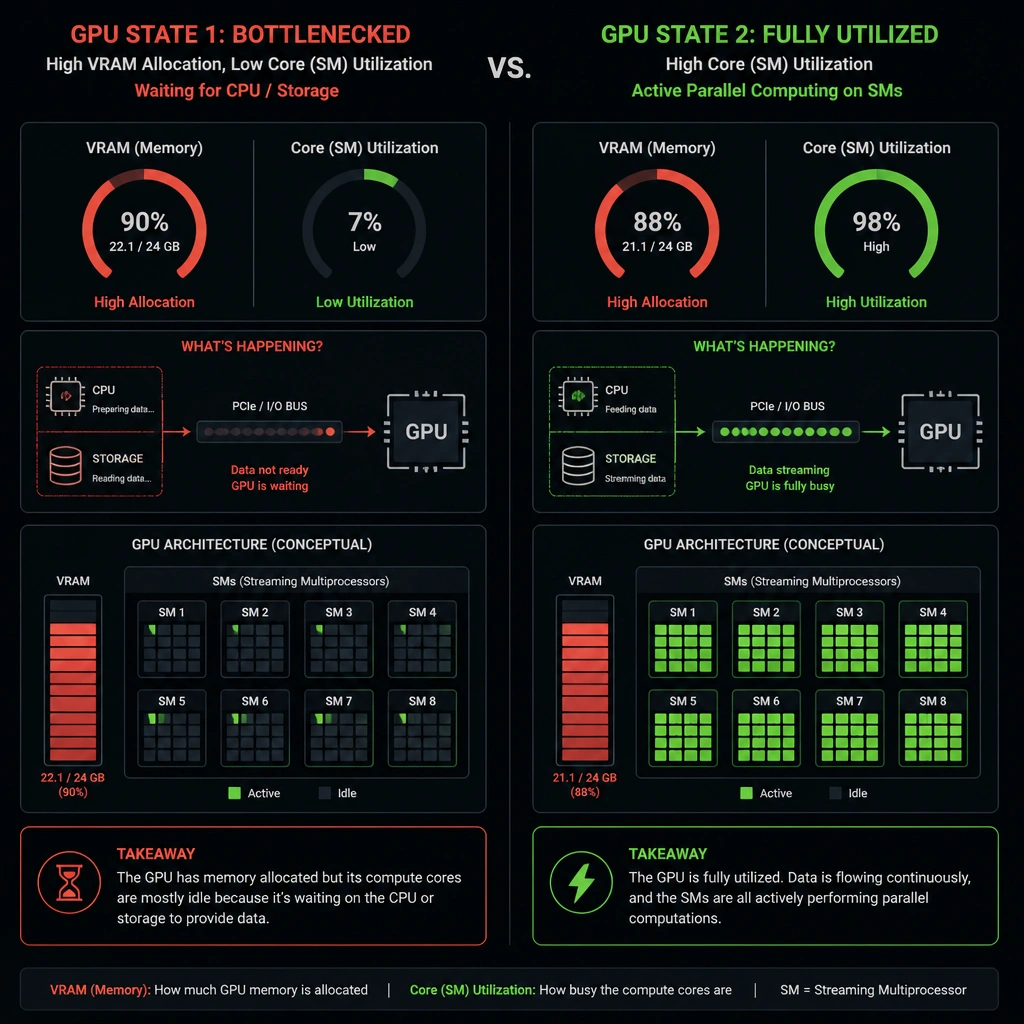
Here's the deal: you can't just look at how much memory is allocated on a GPU and assume it's working hard. That's a huge trap! Just because a model has filled up 24GB of VRAM doesn't mean the processors are actually doing any math. The model might just be sitting there waiting for data from the CPU. To know if your GPU is actually crunching numbers, you must look at GPU Core Utilization (often referred to as Streaming Multiprocessor or SM utilization). If this number is low—say, under 50%—but your VRAM is full, you've got a bottleneck somewhere else, like slow storage or a bottlenecked data loader. Monitor those SMs to make sure you're getting your money's worth out of your silicon! Got it? Let's keep rolling.
Full explanation below image
Full Explanation
In accelerated computing infrastructure, monitoring the performance and utilization of GPUs is crucial for cost optimization and troubleshooting. When analyzing why training or inference jobs are underperforming, administrators must distinguish between memory reservation and active processing.
GPU Core Utilization (specifically, Streaming Multiprocessor or SM utilization) is the most critical metric for determining if a GPU is actively executing compute kernels. It measures the percentage of time over a sample period that one or more kernels were executing on the GPU. If core utilization is low, the GPU's compute engines are idle, indicating that the workload is bottlenecked elsewhere. Common culprits include CPU-based data preprocessing, disk I/O latency, or network synchronization in a distributed setup. By monitoring SM utilization, administrators can identify these bottlenecks and tune their training pipelines accordingly to maximize throughput.
Let's analyze the incorrect options: GPU Memory (VRAM) Allocation: This indicates how much memory has been allocated (e.g., storing weights, activations, and batches). VRAM can be 100% full even if the GPU core is 0% utilized, as the data simply resides in memory without active computation occurring. PCIe Bus Bandwidth Transmitted/Received: This measures the data transfer rate between the host CPU/system memory and the GPU. While high PCIe traffic shows data is moving, it does not measure the actual computation happening on the GPU cores. * GPU Core Temperature: While temperature can indicate thermal throttling if it exceeds safety limits, it is an environmental byproduct, not a direct measure of active compute resource utilization. A cold GPU with low temperature is likely idle, but a warm GPU is not necessarily doing productive work.