You are architecting a real-time analytics dashboard to monitor high-velocity, high-volume data streams (such as live social media feeds or IoT sensor telemetry). The dashboard must ingest millions of events per second, detect anomalies, and render live visual trends instantly. Which strategy most effectively utilizes GPU acceleration to handle both the real-time data processing and visualization stages?
Select an answer to reveal the explanation.
Short Explanation and Infographic
Here's the deal: if you try to build a real-time dashboard for millions of live social media events using a traditional relational database, your system is going to choke. Relational databases are great for transaction data, but they aren't designed to ingest massive streams and run heavy analytical queries at the exact same time. The CPU simply runs out of gas. To make this work in the real world, you want a GPU-accelerated database and analytics engine like HEAVY.AI (formerly MapD). The cool thing is, these databases leverage the massive parallel processing power of GPUs to run SQL queries over billions of rows in milliseconds. Even better, they can render the visual charts and maps directly in GPU memory and send a lightweight image to your browser, bypassing the bottleneck of transferring raw data over the network. That's how you get true real-time, interactive insights without lag!
Full explanation below image
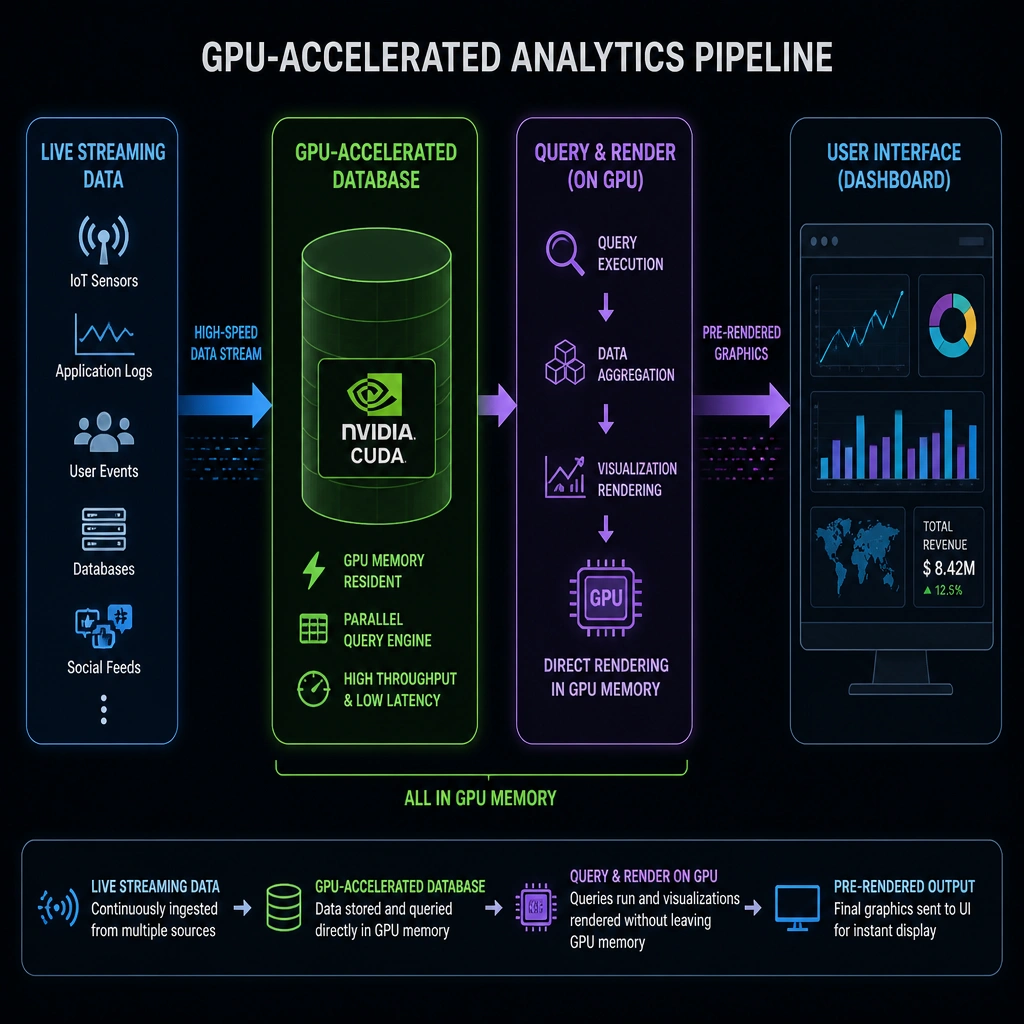
Full Explanation
Ingesting and visualizing high-velocity data streams in real time requires database engines capable of high-throughput ingestion and sub-second query execution. Traditional relational databases (RDBMS) rely on row-based storage and CPU execution, which become performance bottlenecks when processing millions of writes and reads simultaneously.
To address this, organizations employ GPU-accelerated databases and analytics platforms (such as HEAVY.AI). These engines utilize the parallel architecture of GPUs to accelerate both SQL query execution and visual rendering: 1. Parallel Query Processing: A GPU-accelerated database stores data in a columnar format and runs query operations (like filters, aggregations, and joins) across thousands of GPU cores simultaneously. This allows it to query billions of rows of time-series or geospatial data with millisecond latency. 2. In-Memory Rendering: Rather than querying the data, sending raw records over the network to a client web browser, and having the client CPU render the visualization, a GPU-accelerated database can render the visual elements (such as heatmaps, scatter plots, or choropleths) directly in GPU VRAM. It then sends a compressed image or lightweight vector representation to the frontend client. This eliminates network bandwidth bottlenecks and client-side rendering limitations, enabling fluid, interactive dashboards.
Let's analyze the incorrect options: Traditional RDBMS (CPU-based): These are optimized for ACID-compliant transactional workloads (OLTP) rather than real-time parallel analytics on massive, streaming time-series data. CPU-based ETL and flat files: Processing high-velocity data via traditional CPU ETL and writing to flat files introduces high latency and does not support real-time interactive querying or visualization. * GPU-accelerated deep learning classifier to spreadsheet: While a classifier can generate sentiment tags, passing the output to a standard spreadsheet does not leverage GPU acceleration for the visualization or database ingestion stages, and spreadsheets cannot handle high-velocity, multi-million-row streams.