While monitoring a deep learning training job on a rack-mounted GPU server, you notice a sudden, sustained drop in the floating-point operations per second (FLOPS) and processing throughput. There are no software errors, and input data pipelines are serving frames normally. You suspect the server is throttling its clock speed to prevent physical hardware damage. Which set of telemetry metrics should you pull from the management interface (such as nvidia-smi) to confirm this hypothesis?
Select an answer to reveal the explanation.
Short Explanation and Infographic
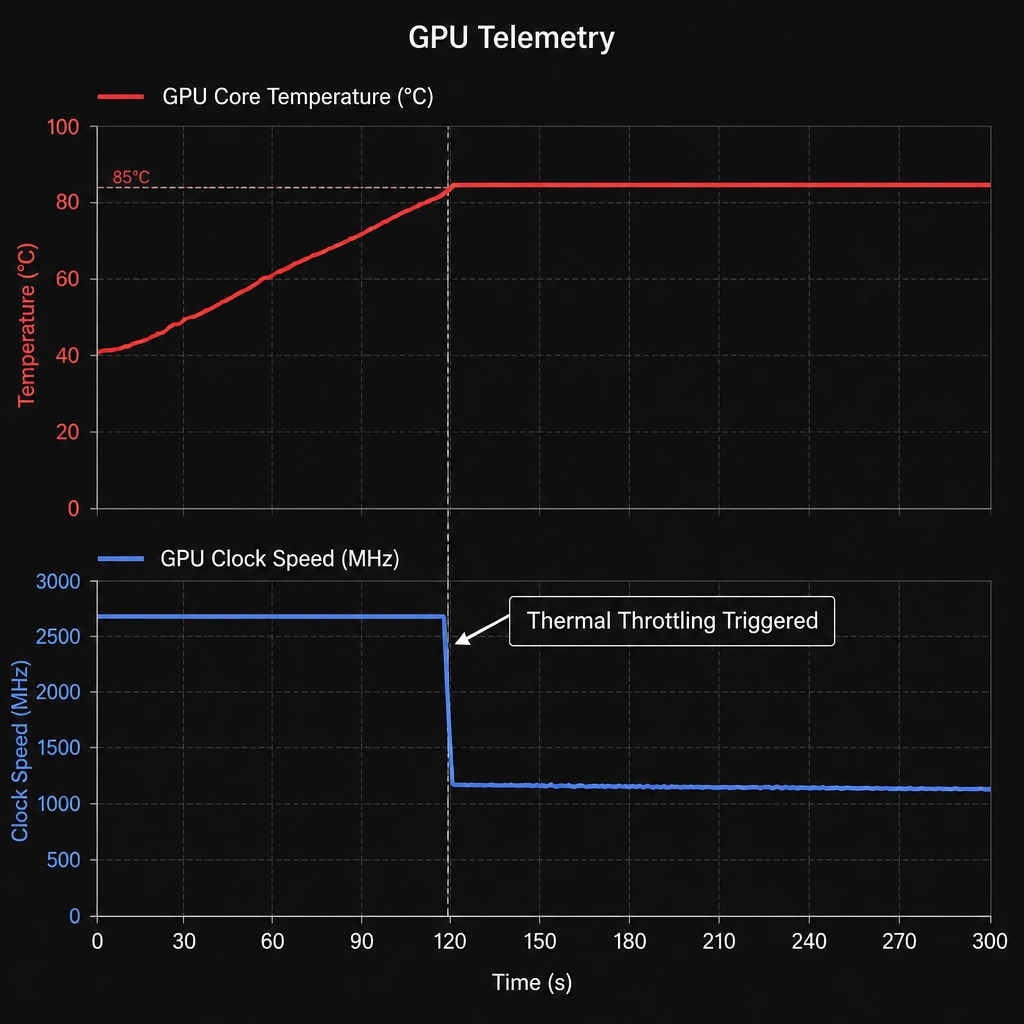
Check this out: when GPUs get too hot, they don't just melt—they protect themselves. They do this by slashing their clock speeds down to a crawl to cool off. We call this thermal throttling, and it will absolute sink your training performance. If you see your training speed suddenly plummet out of nowhere, don't go rewriting your Python code or swapping out cables. First thing you do is run nvidia-smi and check the GPU temperature and the thermal violation flags. If you see temperatures hovering in the high 80s or 90s Celsius, or if the thermal slowdown flag is set to 'Active,' you've found your culprit. Your server room AC is probably struggling, or your server's fans are choked with dust!
Full explanation below image
Full Explanation
Thermal throttling is a critical hardware protection mechanism implemented in modern GPUs. When a GPU is subjected to sustained high compute loads, such as during deep learning training, it generates massive amounts of heat. If the cooling infrastructure (fans, ambient server room air, or liquid cooling systems) cannot dissipate this heat, the GPU core temperature will rise. Once the temperature passes a specific safety threshold (typically between 80°C and 85°C), the GPU's onboard power management controller automatically reduces the clock frequency and operating voltage to prevent permanent silicon damage. This reduction directly slows down processing throughput. To diagnose this, operators must monitor the GPU core temperature and the associated thermal throttling status flags, which indicate whether the clocks are actively being limited due to thermal violations.
Analyzing other metrics will not provide direct confirmation of thermal throttling. PCIe link width and generation status (Option A) diagnostic tools help troubleshoot host-to-device communication bottleneck issues, not internal thermal states. Memory bus utilization (Option C) measures memory subsystem throughput; although it may drop as a side-effect of thermal slowdown, it is not a diagnostic tool for temperature issues. Fan speed percentage (Option D) indicates how hard the cooling system is working, but a fan at 100% capacity does not guarantee that thermal throttling is active or inactive, and CPU socket power draw is unrelated to the GPU's internal thermal protection status.