You need to analyze the performance of a 4-hour, multi-GPU model training run to find out why performance drops periodically. You want a single visual representation that shows the utilization level of every GPU in the cluster across the entire duration of the training. Which visualization type is most effective for identifying these temporal patterns and synchronization bottlenecks?
Select an answer to reveal the explanation.
Short Explanation and Infographic
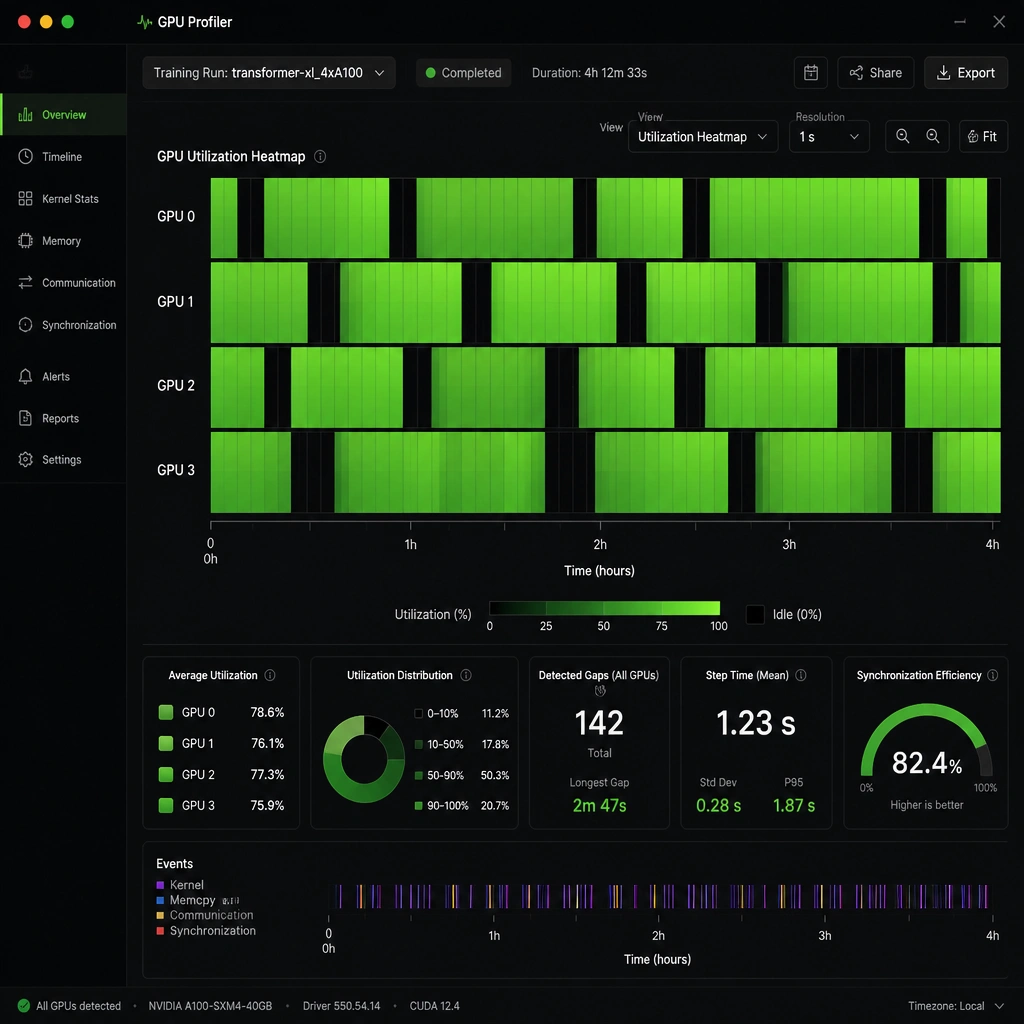
Check this out: if you're trying to debug a training run that takes hours across multiple GPUs, you need to see when things are breaking. A pie chart is completely useless here because it just lumps all the active time into one big slice—you'll have no idea if a GPU sat idle for an hour in the middle of the run. A heatmap is your secret weapon. It plots your GPUs on one axis and time on the other, using color intensity to show utilization. If you see a solid bright block turn completely cold (dark) across all GPUs at the exact same time, you know you've found a data-loading bottleneck or a sync issue. It's clean, visual, and points you right to the problem. Trust me, heatmaps make troubleshooting multi-GPU setups ten times easier.
Full explanation below image
Full Explanation
To diagnose performance issues in distributed deep learning training, engineers must examine system metrics over time. A temporal heatmap is highly effective because it represents three dimensions of data on a two-dimensional plot: time on the horizontal axis, the individual GPUs on the vertical axis, and the utilization level represented by color intensity (e.g., bright colors for 100% load, dark colors for idle). This visualization allows developers to instantly identify patterns such as step-wise synchronization bottlenecks (where all GPUs drop to 0% utilization waiting for parameter aggregation) or straggler nodes (where one GPU is fully loaded while others wait).
Why the distractors fail to provide this detail: - Pie charts (Option A) aggregate time-series data into a single average. While they can show which GPU did the most cumulative work, they strip away all temporal context, making it impossible to spot transient bottlenecks or sync drops. - Box plots (Option C) show statistical distribution (median, quartiles, outliers) of resource utilization. While good for identifying general variance, they do not show when the changes occurred, hiding the relationship between specific training steps and resource drops. - Stacked bar charts (Option D) summarize cumulative hourly data. This level of aggregation is too coarse to identify sub-second or sub-minute synchronization issues common in distributed training (e.g., all-reduce operations).
Therefore, the high resolution and time-series mapping of a heatmap make it the standard choice for GPU profiling dashboards like TensorBoard or NVIDIA Nsight Systems.